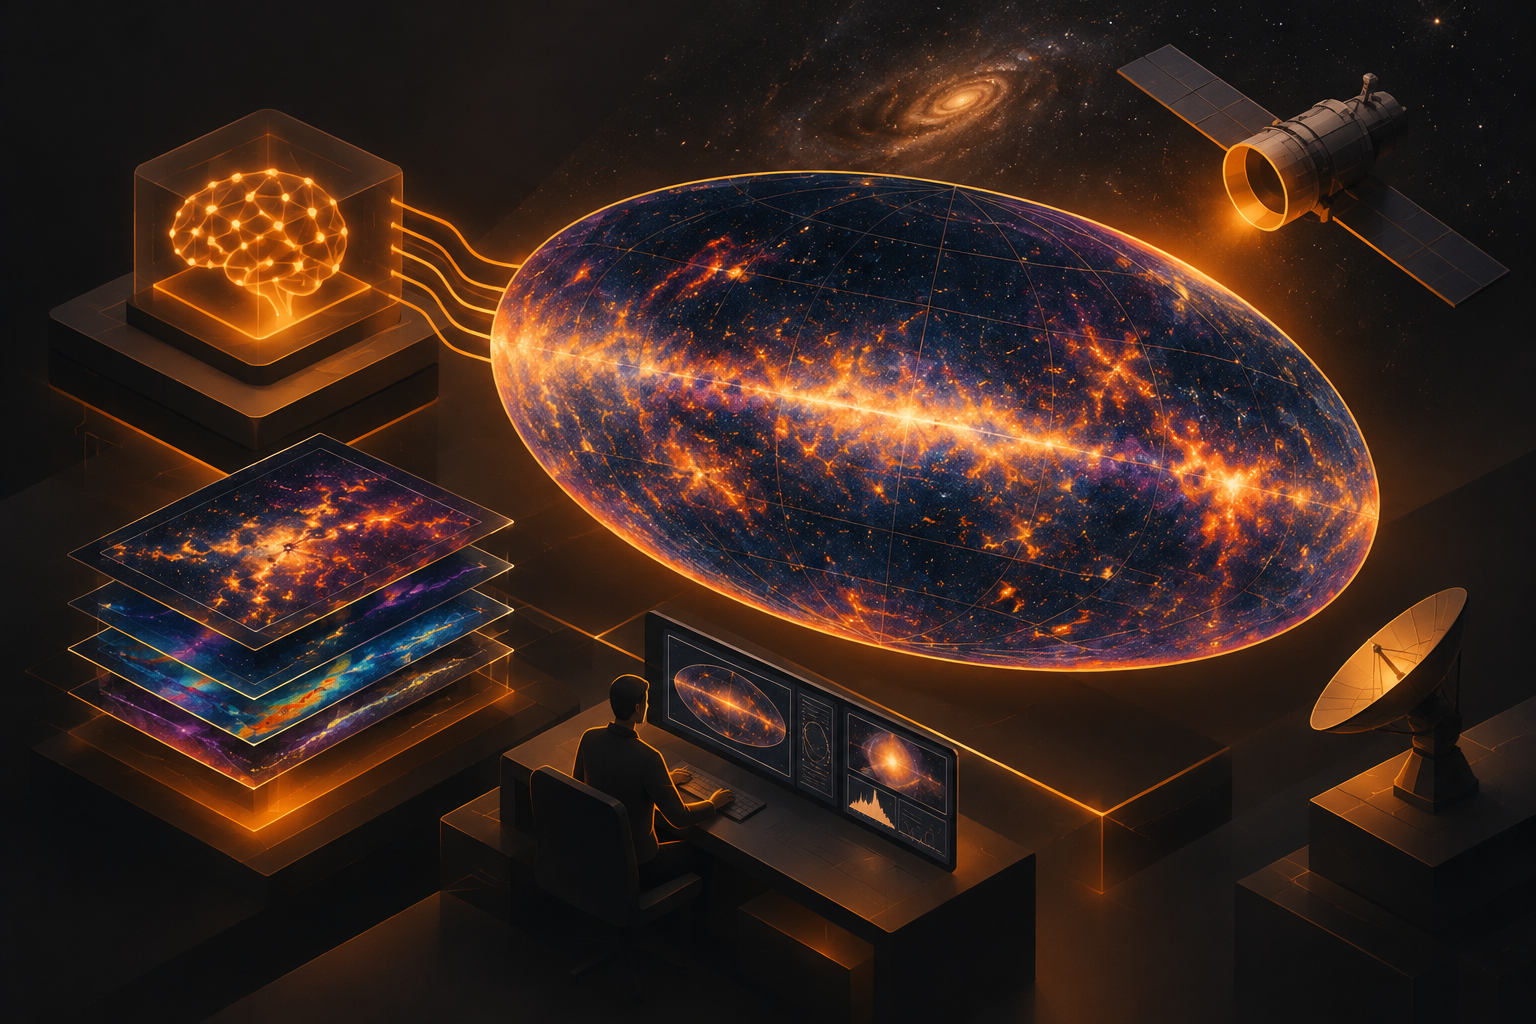
Claude Science has just accomplished what was previously too demanding: creating a complete map of the sky in ultraviolet light. Brice Ménard, an astrophysicist at Johns Hopkins University and researcher at Anthropic, used the AI system to predict approximately one-third of the map – particularly large sections of the galactic plane – filling gaps left by previous space telescopes.
The essentials
- First complete UV sky map created using Claude Science; roughly one-third of the map was predicted by the AI
- NASA's GALEX mission (2003–2013) observed only about two-thirds of the sky and deliberately skipped bright stars and the galactic plane
- Ménard's work typically required weeks of manual calibration and analysis – Claude made this task feasible
- The map will serve as an educational tool for astrophysics students, revealing the structure of the Milky Way in UV light
Why a complete UV map didn't exist
Ultraviolet light is absorbed by Earth's atmosphere – requiring space telescopes to observe it. The largest data source was NASA's GALEX mission, which ran from 2003 to 2013 and imaged roughly two-thirds of the sky in approximately 38,000 separate observations. However, GALEX deliberately avoided very bright stars – especially in the galactic plane where stars are most densely packed – to protect the satellite's sensitive detectors from damage.
Other space telescopes like NASA's Swift and South Korea's FIMS/SPEAR contributed additional data, yet even combined, significant gaps remained. Statistical methods could fill these gaps, but doing so properly demands weeks of painstaking work with pixel-level calibration and repeated analyses – effort astrophysicists typically defer in favor of more urgent research.
Claude makes the impossible practical
"With Claude, it has become easier to tackle such lower-priority work," Ménard explains.
This summer, Ménard set out to create the missing map using Claude Science. The instructions were simple to state but difficult to execute: gather all available UV data, calibrate it, statistically fill the gaps, and produce a complete map with uncertainty estimates.
The result: an interactive map of the entire sky with the galactic center in the middle, combining Far-UV (154 nm) and Near-UV (232 nm). Additional layers mark each pixel as "measured" or "predicted" and provide uncertainty estimates. This eliminates the need to apologize in the lecture hall – Ménard can now show his students how UV light reveals dust illuminated by starlight: from clouds around young stars to rings left by stellar explosions.
What this means for science
The map is more than an educational tool. It illustrates a broader pattern: many scientific fields have backlogs of projects that would explain key concepts or assist other researchers – but never rise high enough on anyone's priority list because manual work is too demanding. Claude Science makes such projects suddenly feasible without researchers sacrificing months of time.
For German research institutions and universities, this could mean reconsidering previously shelved data preparation and analysis projects. Frontier AI systems like Claude Science might free up resources – but only if institutions build the necessary infrastructure and expertise to use such tools effectively. Simultaneously, questions arise about reproducibility and validation: how transparent must AI-assisted scientific predictions be to be considered reliable?
Sources
Editorially owned by Ideal Syka. Sources and method: Newsroom & method. Tips and corrections: ai@i6eal.de.